## Warning: The `printer` argument is deprecated as of rlang 0.3.0.
## This warning is displayed once per session.
The greatest value of a picture is when it forces us to notice what we never expected to see.
— John Tukey
I remember taking a class with coatless while I was still in my third year of undergraduate, completely devoid of any programming language. He struck upon me as a teacher who was ridiculously enthusiastic about R, though was passionate and careful in explaining the fundamental concepts to his students. In one of his lessons, he talked about an app called Shiny that provides an interactive Live interface with the user. Sounds cool? Well, it is. More so, it is one of the things in programming that forces interactivity between a human and a computer. Just think about the endless possibility!
Here is a Shiny app that uses voice recognition.
Shiny builds on the idea that one can build interactive web apps straight from R. It has two main components, a user interface (UI) and a server. A server is typically defined as the backend of data retrieval and functionality that perform all the transformations, while the UI serves as the frontend or client-side where a user interacts accordingly given a set of inputs, sort of like how the customer service/service provider works.
As an activity, I was told to visualize data on a Shiny app and interpret the results. I carefully picked a topic and decided to do a project about gun-related deaths in the United States. I gathered a dataset from FiveThirtyEight that has data collected by the Centers for Disease Control and Prevention (CDC) on gun-related deaths from the year 2012 to 2014. Fast forward the data wrangling, we are ready to build a Shiny app.
Let’s start by building the UI template for our Shiny app. (final product)
Step 1: Define a UI.
library(shiny)

ui = shinyUI(
  fluidPage(
    titlePanel("Gun-Related Deaths in the United States (2012-2014)"), #Title
    sidebarLayout(
      sidebarPanel(
        h1("This is my input")
      ),
      mainPanel("This is my output")
    ) # close: sidebarLayout()
  ) # close: fluidPage()
) # close: shinyUI()

server = function(input, output){}

shinyApp(ui, server)
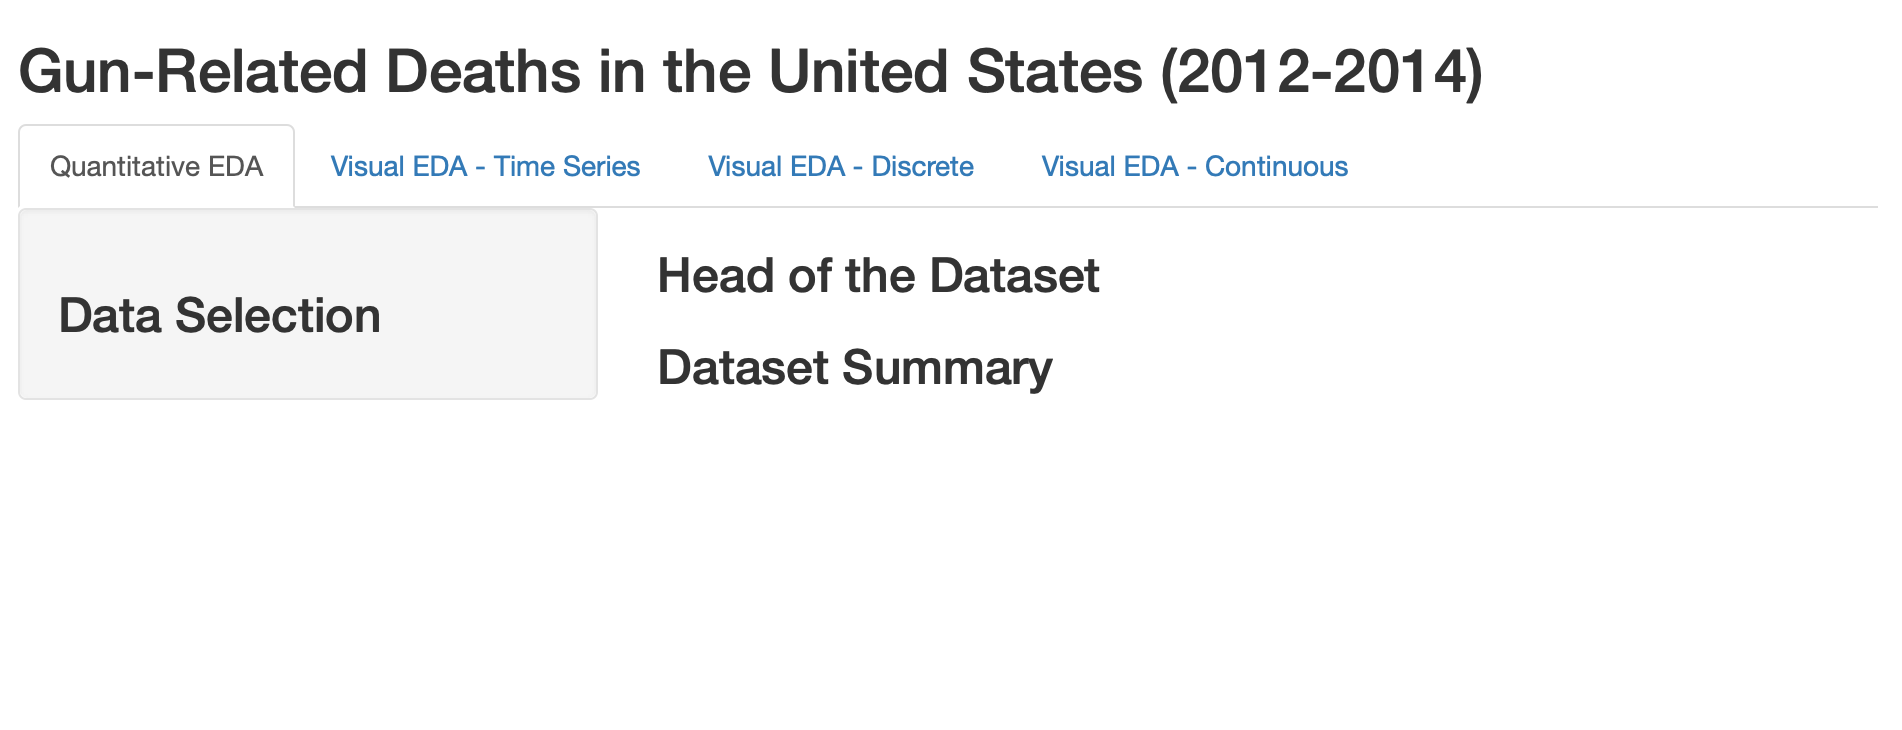
This is the raw backbone behind our Shiny app. For our app, we want to make four different types of visualization, so ideally we would want four different tabs. To achieve that, we would use tabsetPanel() and within it, four tabPanel()’s, in which we would include the same structure as we did previously. I shortened “Explanatory Data Analysis” to just EDA.
library(shiny)

ui = fluidPage(
  titlePanel("Gun-Related Deaths in the United States (2012-2014)"),
  tabsetPanel(
    tabPanel("Quantitative EDA", fluid = TRUE,           #tab 1
             sidebarLayout(
               sidebarPanel(
                 h3("Data Selection")
                 ),
               mainPanel(
                 h3("Head of the Dataset"),
                 h3("Dataset Summary")
                 )
               )
             ),
    tabPanel("Visual EDA - Time Series", fluid = TRUE,   #tab 2
             sidebarLayout(
               sidebarPanel(
                 h3("Type of Graph")
                 ),
               mainPanel(
                 h3("Trendlines")
                 )
               )
             ),
    tabPanel("Visual EDA - Discrete", fluid = TRUE,      #tab 3
             sidebarLayout(
               sidebarPanel(
                 h3("Type of Graph")
                 ),
               mainPanel(
                 h3("Discrete Variable")
                 )
               )
             ),
    tabPanel("Visual EDA - Continuous", fluid = TRUE,    #tab 4
             sidebarLayout(
               sidebarPanel(
                 h3("Type of Graph")
                 ),
               mainPanel(
                 h3("Continuous Varible")
                 )
               )
             )
    )
  )

server = function(input, output) {}

shinyApp(ui, server)
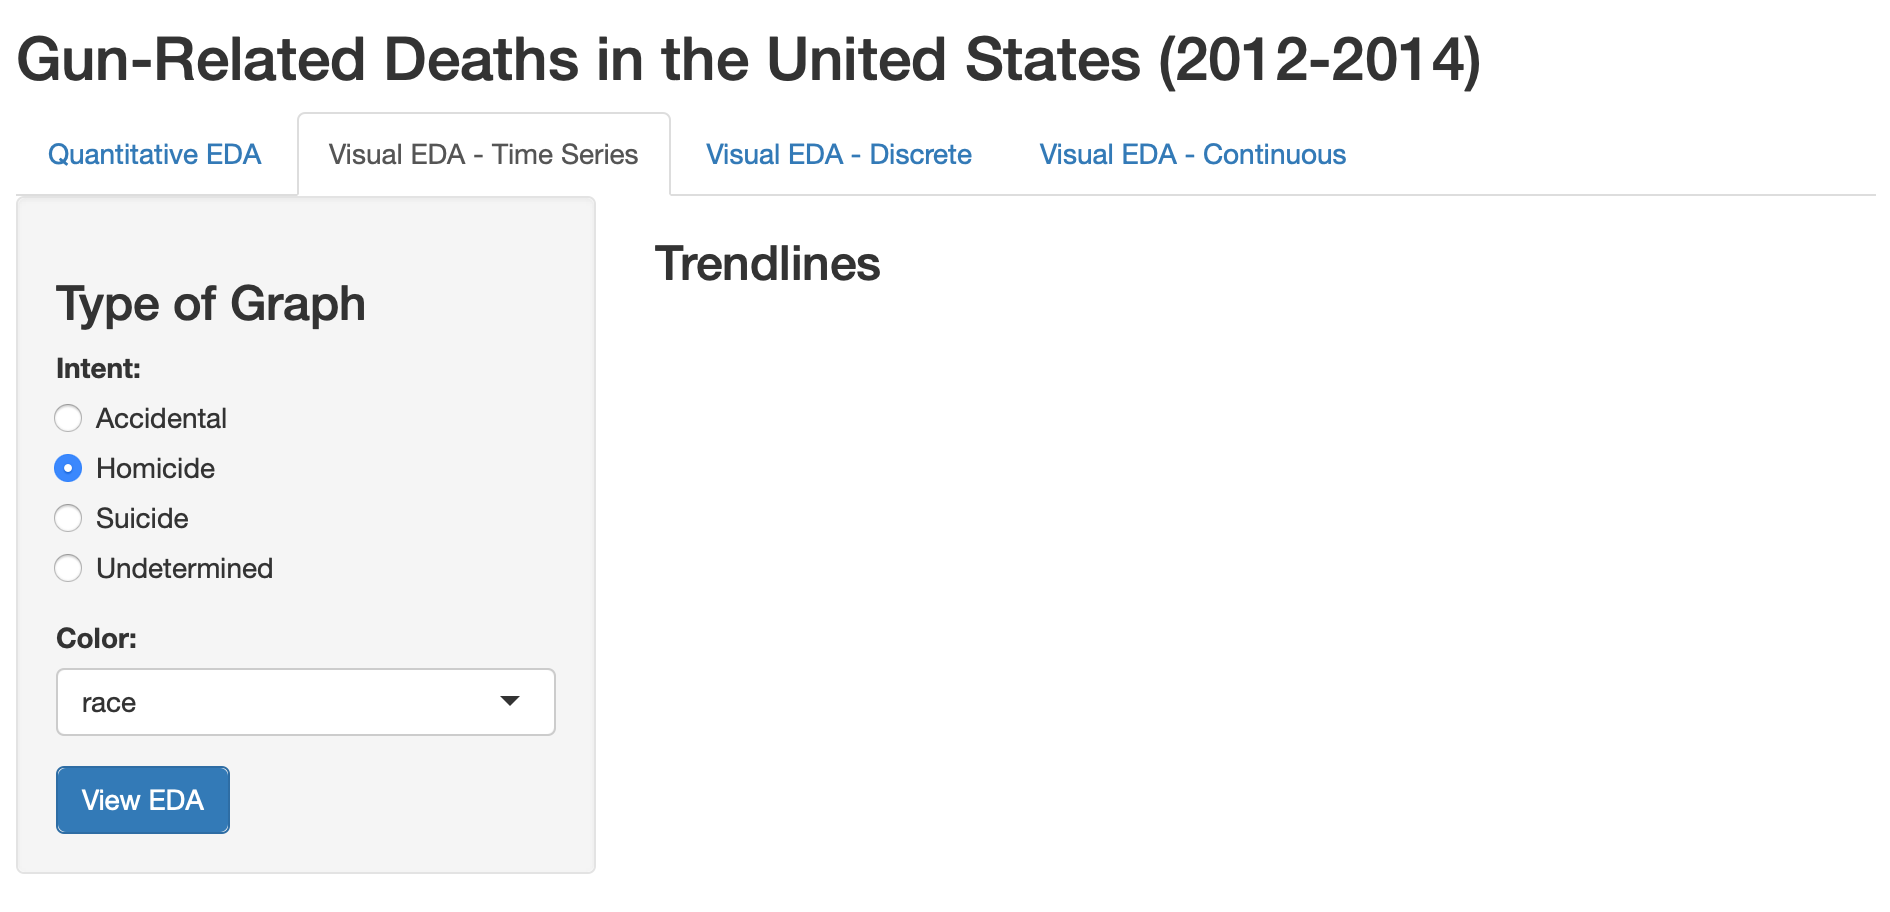
Next, we would want to define control widgets to feed our active inputs. To that end, we would want to use numericInput(), selectInput() and radioButtons(). A list of other control widgets can be found on the Shiny cheatsheet. We would also want to add submitButton() to prevent reaction on the entire app.
ui = fluidPage(
  titlePanel("Gun-Related Deaths in the United States (2012-2014)"),
  tabsetPanel(
    tabPanel("Quantitative EDA", fluid = TRUE,
             sidebarLayout(
               sidebarPanel(
                 h3("Data Selection"),
                 numericInput(inputId = "obs",
                              label = "Number of Observations:",
                              value = 3),                                   #numeric input
                 submitButton(text="View EDA")                              #submit button
                 ),
               mainPanel(
                 h3("Head of the Dataset"),
                 h3("Dataset Summary")
                 )
               )
             ),
    tabPanel("Visual EDA - Time Series", fluid = TRUE,
             sidebarLayout(
               sidebarPanel(
                 h3("Type of Graph"),
                 radioButtons(inputId = "intent",
                              label = "Intent:",
                              choices = levels(cases_new$intent),
                              selected = "Homicide"),                        #checkbox
                 selectInput(inputId = "trendline_color",
                             label = "Color:",
                             choices = colnames(cases_new)[c(5:6,8,10:11)],
                             selected = "race"),                             #dropdown
                 submitButton(text="View EDA")                               #submit button
                 ),
               mainPanel(
                 h3("Trendlines")
                 )
               )
             ),
    tabPanel("Visual EDA - Discrete", fluid = TRUE,
             sidebarLayout(
               sidebarPanel(
                 h3("Type of Graph"),
                 radioButtons(inputId = "variable",
                              label = "Variable:",
                              choices = colnames(cases_new)[c(4:6,8,10:11)],
                              selected = "intent"),                           #checkbox
                 selectInput(inputId = "discrete_color",
                             label = "Color:",
                             choices = colnames(cases_new)[c(4:6,8,10:11)],
                             selected = "race"),                              #dropdown
                 submitButton(text="View EDA")                                #submit button
                 ),
               mainPanel(
                 h3("Discrete Variable")
                 )
               )
             ),
    tabPanel("Visual EDA - Continuous", fluid = TRUE,
             sidebarLayout(
               sidebarPanel(
                 h3("Type of Graph"),
                 h5("Independent Variable: Age"),
                 radioButtons(inputId = "plot_type",
                              label = "Plot:",
                              choices = c("density plot","box plot"),
                              selected = "density plot"),                     #checkbox
                 selectInput(inputId = "continuous_color",
                             label = "Color:",
                             choices = colnames(cases_new)[c(4:6,8,10:11)],
                             selected = "race"),                              #dropdown
                 submitButton(text="View EDA")                                #submit button
                 ),
               mainPanel(
                 h3("Continuous Varible")
                 )
               )
             )
    )
  )

server = function(input, output) {}

shinyApp(ui, server)
The inputID argument in each widget function will be used to call out our inputs when we feed them into the server.
Then, we would want to define the types of output within each mainPanel() that we would want to show on the UI. The output on the UI will work hand-in-hand with the render*() functions in the server. Again, for a list of them, check the cheatsheet.
ui = fluidPage(
  titlePanel("Gun-Related Deaths in the United States (2012-2014)"),
  tabsetPanel(
    tabPanel("Quantitative EDA", fluid = TRUE,
             sidebarLayout(
               sidebarPanel(
                 h3("Data Selection"),
                 numericInput(inputId = "obs",
                              label = "Number of Observations:",
                              value = 3),
                 submitButton(text="View EDA")
                 ),
               mainPanel(
                 h3("Head of the Dataset"),
                 tableOutput("view"),                             #table output
                 h3("Dataset Summary"),
                 verbatimTextOutput("summary")                    #text output
                 )
               )
             ),
    tabPanel("Visual EDA - Time Series", fluid = TRUE,
             sidebarLayout(
               sidebarPanel(
                 h3("Type of Graph"),
                 radioButtons(inputId = "intent",
                              label = "Intent:",
                              choices = levels(cases_new$intent),
                              selected = "Homicide"),
                 selectInput(inputId = "trendline_color",
                             label = "Color:",
                             choices = colnames(cases_new)[c(5:6,8,10:11)],
                             selected = "race"),
                 submitButton(text="View EDA")
                 ),
               mainPanel(
                 h3("Trendlines"),
                 plotOutput("plot1")                               #plot output
                 )
               )
             ),
    tabPanel("Visual EDA - Discrete", fluid = TRUE,
             sidebarLayout(
               sidebarPanel(
                 h3("Type of Graph"),
                 radioButtons(inputId = "variable",
                              label = "Variable:",
                              choices = colnames(cases_new)[c(4:6,8,10:11)],
                              selected = "intent"),
                 selectInput(inputId = "discrete_color",
                             label = "Color:",
                             choices = colnames(cases_new)[c(4:6,8,10:11)],
                             selected = "race"),
                 submitButton(text="View EDA")
                 ),
               mainPanel(
                 h3("Discrete Variable"),
                 plotOutput("plot2")                                #plot output
                 )
               )
             ),
    tabPanel("Visual EDA - Continuous", fluid = TRUE,
             sidebarLayout(
               sidebarPanel(
                 h3("Type of Graph"),
                 h5("Independent Variable: Age"),
                 radioButtons(inputId = "plot_type",
                              label = "Plot:",
                              choices = c("density plot","box plot"),
                              selected = "density plot"),
                 selectInput(inputId = "continuous_color",
                             label = "Color:",
                             choices = colnames(cases_new)[c(4:6,8,10:11)],
                             selected = "race"),
                 submitButton(text="View EDA")
                 ),
               mainPanel(
                 h3("Continuous Varible"),
                 plotOutput("plot3")                                 #plot output
                 )
               )
             )
    )
  )

server = function(input, output) {}

shinyApp(ui, server)
Step 2: Define a server.
After all that is done, now on to the “easier” part. For our server, we require two basic things: a reactive source (which we would call as the input) and a reactive endpoint (which we would call as the output), to which we will attempt to connect the two of them. As an intermediary point, we would also define a reactive conductor using the reactive({}) call in shiny. Based on the previous input and output defined on our UI, we will update our server function with the following:
(For a list of render*() functions, check cheatsheet.)
ui = fluidPage(
  titlePanel("Gun-Related Deaths in the United States (2012-2014)"),
  tabsetPanel(
    tabPanel("Quantitative EDA", fluid = TRUE,
             sidebarLayout(
               sidebarPanel(
                 h3("Data Selection"),
                 numericInput(inputId = "obs",
                              label = "Number of Observations:",
                              value = 3),
                 submitButton(text="View EDA")
                 ),
               mainPanel(
                 h3("Head of the Dataset"),
                 tableOutput("view"),
                 h3("Dataset Summary"),
                 verbatimTextOutput("summary")
                 )
               )
             ),
    tabPanel("Visual EDA - Time Series", fluid = TRUE,
             sidebarLayout(
               sidebarPanel(
                 h3("Type of Graph"),
                 radioButtons(inputId = "intent",
                              label = "Intent:",
                              choices = levels(cases_new$intent),
                              selected = "Homicide"),
                 selectInput(inputId = "trendline_color",
                             label = "Color:",
                             choices = colnames(cases_new)[c(5:6,8,10:11)],
                             selected = "race"),
                 submitButton(text="View EDA")
                 ),
               mainPanel(
                 h3("Trendlines"),
                 plotOutput("plot1")
                 )
               )
             ),
    tabPanel("Visual EDA - Discrete", fluid = TRUE,
             sidebarLayout(
               sidebarPanel(
                 h3("Type of Graph"),
                 radioButtons(inputId = "variable",
                              label = "Variable:",
                              choices = colnames(cases_new)[c(4:6,8,10:11)],
                              selected = "intent"),
                 selectInput(inputId = "discrete_color",
                             label = "Color:",
                             choices = colnames(cases_new)[c(4:6,8,10:11)],
                             selected = "race"),
                 submitButton(text="View EDA")
                 ),
               mainPanel(
                 h3("Discrete Variable"),
                 plotOutput("plot2")
                 )
               )
             ),
    tabPanel("Visual EDA - Continuous", fluid = TRUE,
             sidebarLayout(
               sidebarPanel(
                 h3("Type of Graph"),
                 h5("Independent Variable: Age"),
                 radioButtons(inputId = "plot_type",
                              label = "Plot:",
                              choices = c("density plot","box plot"),
                              selected = "density plot"),
                 selectInput(inputId = "continuous_color",
                             label = "Color:",
                             choices = colnames(cases_new)[c(4:6,8,10:11)],
                             selected = "race"),
                 submitButton(text="View EDA")
                 ),
               mainPanel(
                 h3("Continuous Varible"),
                 plotOutput("plot3")
                 )
               )
             )
    )
  )

server = function(input, output) {
  active_dataset_trendline= reactive({
    if(input$intent == "Homicide") {
      count_transformation(homicide_cases, input$trendline_color)
      } else if (input$intent == "Suicide") {
        count_transformation(suicide_cases, input$trendline_color)
        } else if(input$intent == "Accidental"){
          count_transformation(accidental_cases, input$trendline_color)
            } else if (input$intent == "Undetermined"){
              count_transformation(undetermined_cases, input$trendline_color)
            }
        })    #reactive conductor, i.e. transformed dataset

  active_graph= reactive({
    if(input$plot_type == "density plot") {
      density_plot(cases_new, "age", color = input$continuous_color) +
        labs(title = paste("Deaths: age by",input$continuous_color))
            } else if (input$plot_type == "box plot") {
                box_plot(cases_new, input$continuous_color, "age", color = input$continuous_color) +
                theme(axis.text.x = element_text(angle = 65, hjust = 1)) +
                labs(title = paste("Deaths: age by",input$continuous_color))
            }
        })    #reactive conductor, i.e. desired output for tab 4.
              #Note~ a reactive conductor can be called again to act as an endpoint.

  output$view = renderTable({
    head(case_transformation(cases_new),n = input$obs)
    })
  output$summary = renderPrint({
    summary(case_transformation(cases_new))
    })        #output for tab 1

  output$plot1 = renderPlot({
    line_plot(active_dataset_trendline(), "date", "Total_cases", color = input$trendline_color) +
      labs(title = paste("Deaths:", input$intent,"by",input$trendline_color),  x = "Date", y = "Total Cases")
    })         #output for tab 2

  output$plot2 = renderPlot({
    bar_plot(cases_new, input$variable, fill = input$discrete_color, dodge = TRUE) +
      theme(axis.text.x = element_text(angle = 65, hjust = 1)) +
      labs(title = paste("Deaths:", input$variable,"by",input$discrete_color))
    })         #output for tab 3

  output$plot3 = renderPlot({
    active_graph()
    })         #output for tab 4
}

shinyApp(ui, server)
Now, we are basically done. Our app/dashboard is finished! We now henceforth have the choice to publish our app on a shinyapps.io live server for other people to use, like I have for mine.
The Final Product link to app:
You could also follow the same logic to give your dashboard a more crisp look by downloading the themes from the shinydashboard package available on CRAN.
